Improve your website with Content Grouping reports in Google Analytics
—Do you know which sections of your website are being visited the most? Or which types of content is having the biggest impact on your business? If not, Content Grouping reports in Google Analytics can help.
Measuring your website's performance can be complicated. At best, you analyse your analytics reports and come away with a few questions and an idea of where to improve your strategy. But if you understand how to use these reports to their full potential then you'll start to see how different elements on your website contribute to its success.
Content Grouping provides data on how Google Analytics classifies your website’s content, such as category pages, service pages, news and blogs. It gives you a better understanding of how users interact with your content, and in turn, how you can improve it to deliver an improved user experience.
Content changes regularly on your website to meet the needs of your audience as well as your business goals. However, viewing your Analytics data by Default View can be limited, and reporting on the sections of your website individually is time consuming.
Therefore, we recommend using Content Grouping in Google Analytics for a comprehensive view of all your grouped content – both up to the second and historically. This will give you the overview on how different posts and pages perform with visitor stats and journey analysis data like bounce rate and page duration. The information in these reports can help you decide where to focus marketing efforts like SEO or social media campaigns.
Let's say for example you manage an eCommerce website with a home
page, 100 categories, 500 sub-categories, 10,000 products, 750 news
articles, 100 help guides and a whole bunch of other sections and pages.
It would be impossible to look at the performance of every individual
page and calculate how many visitors each section of your site has had
as a whole.
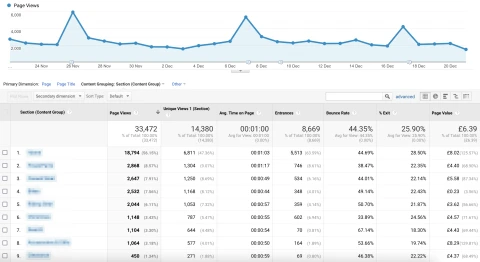
By setting up Content Grouping in Google Analytics provides you with just that; a single table of grouped page performance showing:
- Total pageviews
- Average time spent on those pages
- Number of website entrances on those pages
- Percentage of exits from those pages
- Page value
Here's an example of what the Content Grouping table looks like in Google Analytics:
This is a great feature and something that brings a lot to the table for many website owners. You now have the ability to track how users are engaging with your content, how they're navigating your site and which pages convert visitors most effectively. And armed with this information can help improve your UX, leading to higher conversion rates, better customer satisfaction and general higher site usability.
